Performance Update: Longboard Managed Futures Strategy Fund
By Ross Hendricks
March 5, 2016
The Longboard Managed Futures Strategy Fund returned +1.48%* for the week ending 2/29/16, gaining from short positions in the declining British pound and grain markets such as corn and wheat. These profits more than offset losses from short positions in global stocks, energy markets and the Canadian dollar.
The Longboard Managed Futures Strategy Fund (WAVIX) Fund performance was 7.19% since Inception and 8.91% for the one-year period, both as of 12/31/15. Inception date of WAVIX is 6/27/12. The Longboard Managed Futures Strategy Fund performance (WAVEX) was 8.63% (NAV) and 2.37% (Max Load) for the one-year period ending 12/31/15, and the since inception numbers for WAVEX were 7.69% (NAV) and 5.41% (Max Load) also as of 12/31/15. Inception date of WAVEX is 3/22/2013. Total Annual Operating Expenses are 3.24% and 2.99% for Class A and I Shares respectively.
The performance data quoted here represents past performance. Current performance may be lower or higher than the performance data quoted above. Investment return and principal value will fluctuate, so that shares, when redeemed, may be worth more or less than their original cost. Past performance is no guarantee of future results. For performance information current to the most recent month-end, please call toll-free 855.294.7540.
Correlations converge in risk assets
Crude oil and risk assets continued to move in lockstep with one another.
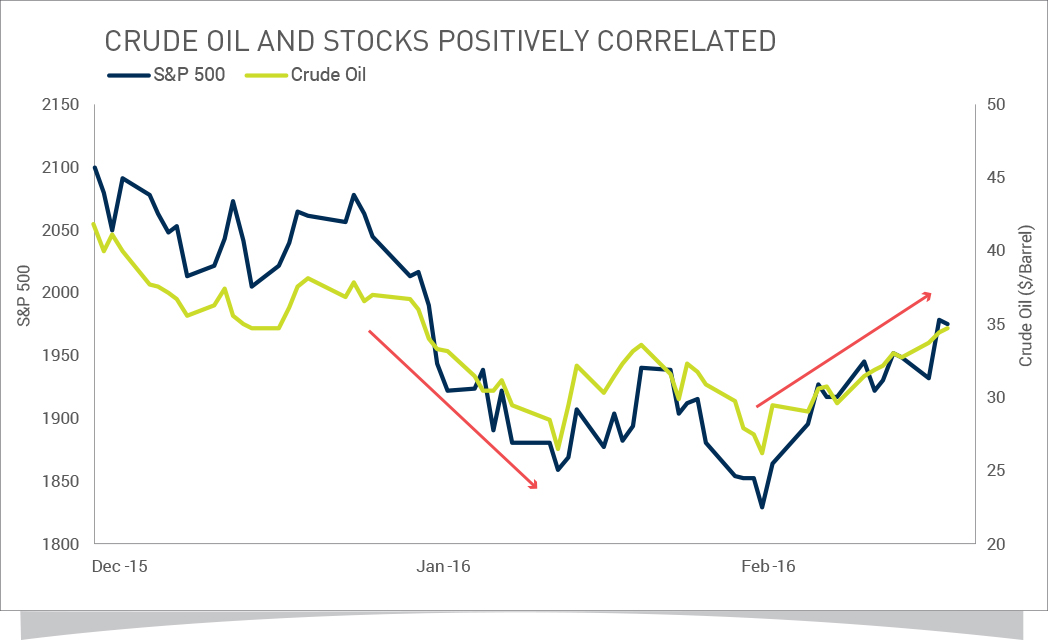
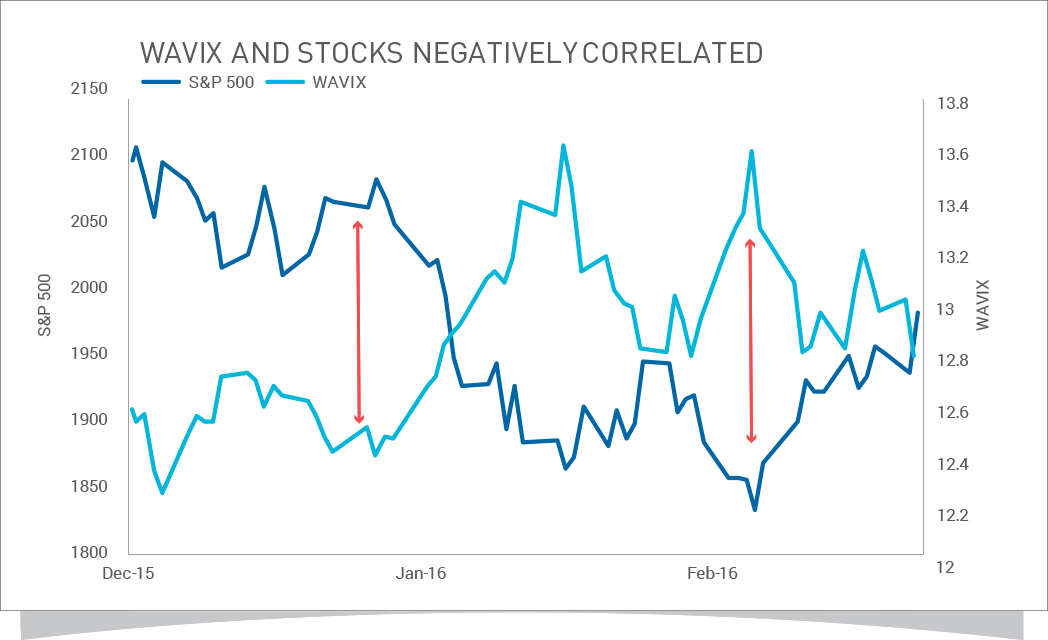
Our net short exposure across global stock and commodity markets is causing the fund to experience positive performance on days when stocks are negative, and vice versa. We believe the fund is currently positioned to deliver a high degree of diversification against traditional asset classes.
The index shown is for informational purposes only and is not reflective of any investment. As it is not possible to invest in the index directly, the data shown does not reflect or compare features of an actual investment, such as its objectives, costs and expenses, liquidity, safety, guarantees or insurance, fluctuation of principal or return, or tax features. Past performance is no guarantee of future results.
S&P 500: A stock market index based on the market capitalization of 500 leading companies publicly traded in the U.S. stock market, as determined by Standard & Poor’s. In this post, the S&P 500 is presented as a total return index, which reflects the effects of dividend reinvestment.
Global headwinds provide pause for bulls
Despite the recent strength in risk assets, we continue to see warning signs in market internals and in economic data. For example, safety trades, like consumer staples, utilities, treasuries and gold, continue to outperform. Two of the biggest winners in U.S. stocks this year have been Campbell Soup Company and Tyson Chicken. In stark contrast, last year’s growth names like Amazon and Netflix are experiencing double-digit losses.
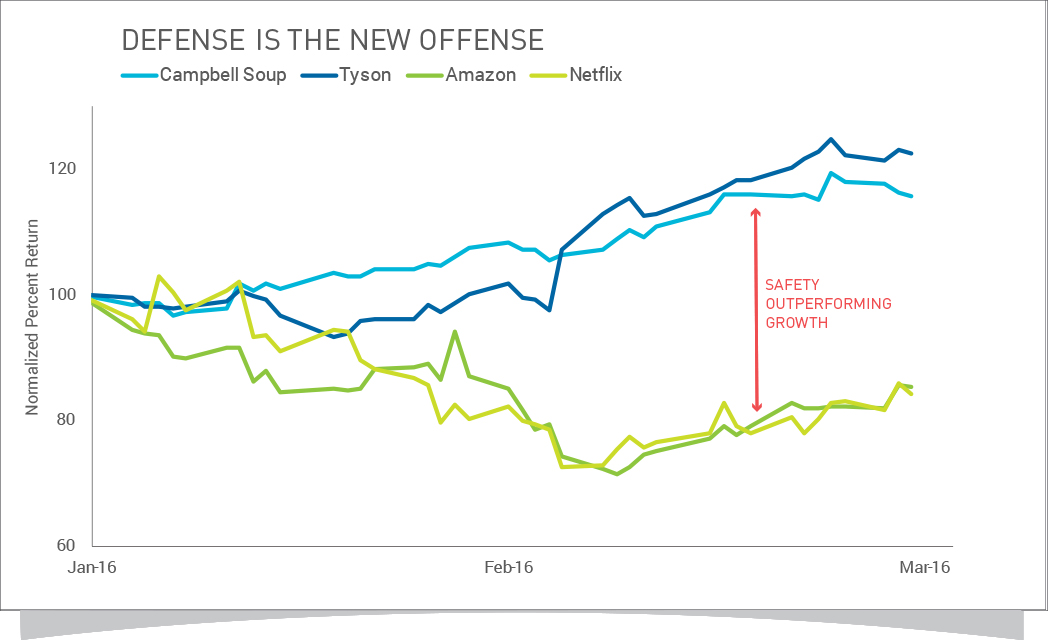
The examples above are not meant to represent fund performance. Rather, the examples demonstrate the shift in market dynamics so far in 2016. Last year’s top performers (growth stocks like Amazon and Netflix) are now underperforming the broader market and we’re now seeing outperformance among stocks typically considered more defensive, like consumer staples. The securities mentioned in the examples are not current fund holdings and are not meant to be investment advice.
Furthermore, incoming data on global trade and manufacturing continues to deteriorate. U.S. freight carloads—a leading indicator of U.S. transportation and economic activity – has been falling sharply since late 2014, a trend which accelerated towards the end of 2015. This confirms the weakness in fourth quarter GDP and the underperformance among transportation stocks throughout 2015.
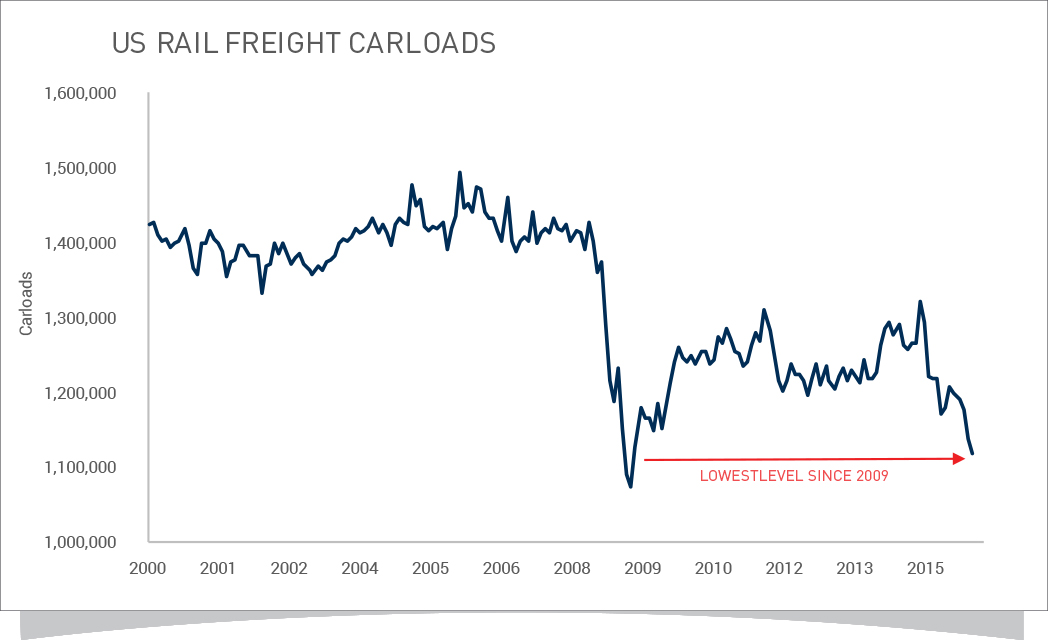
Source information: Seasonally-adjusted rail freight carloads – U.S. Department of Transportation, Bureau of Transportation Statistics (BTS) calculation from data collected by Association of American Railroads
What’s more, crude oil supply is at new record inventory levels and near-record global production levels, despite its recent strength in price. We believe this is providing caution for the bull case.
The index shown is for informational purposes only and is not reflective of any investment. As it is not possible to invest in the index directly, the data shown does not reflect or compare features of an actual investment, such as its objectives, costs and expenses, liquidity, safety, guarantees or insurance, fluctuation of principal or return, or tax features. Past performance is no guarantee of future results.
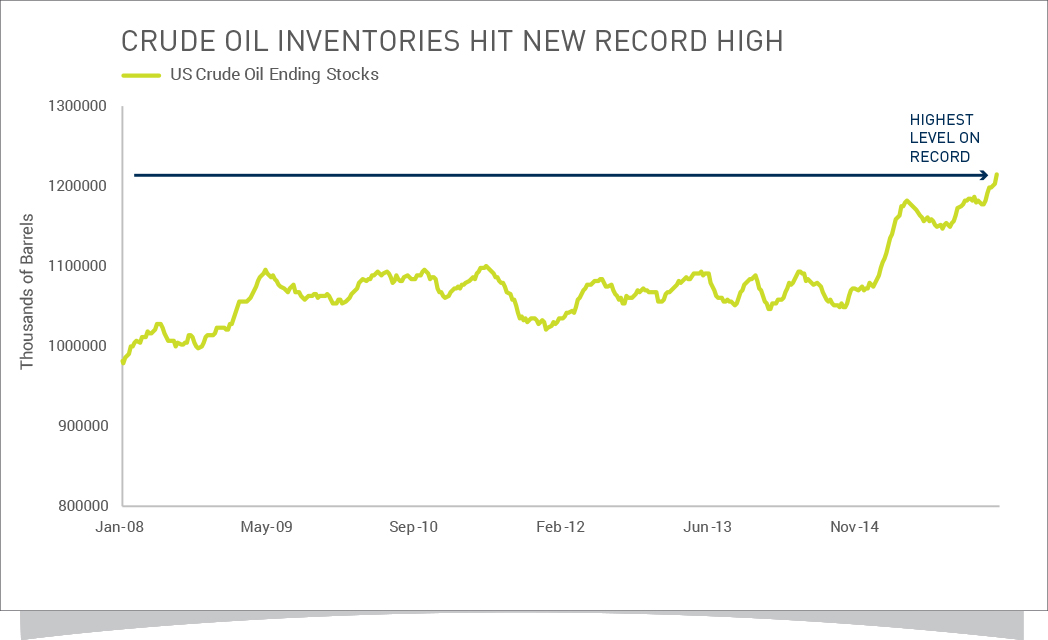
Source: Weekly Petroleum Status Report, published weekly by the Energy Information Administration (EIA). It contains estimates by the EIA on various petroleum data including imports and exports, ending stocks, production and prices.
Currency trends reignited
Trends appear to be reemerging in currencies after a period of relative calm in the latter half of 2015.
The yen has gone nearly straight up since the announcement of negative rates from the BOJ. This counterintuitive trend surprised many market participants who expected negative yields to send the yen lower. Apparently, the pressure from traders covering “carry trade” short positions amid declining risk assets is overwhelming the “fundamental weakness” associated with negative interest rates. Trend following strategies can participate in these market moves because they have the ability to benefit from price movements regardless of what’s driving them – even if it means ignoring fundamentals in favor of what’s truly trending.
Another major trend development has taken shape in the British pound recently, which has weakened on fears over the potential U.K. exit from the Eurozone.
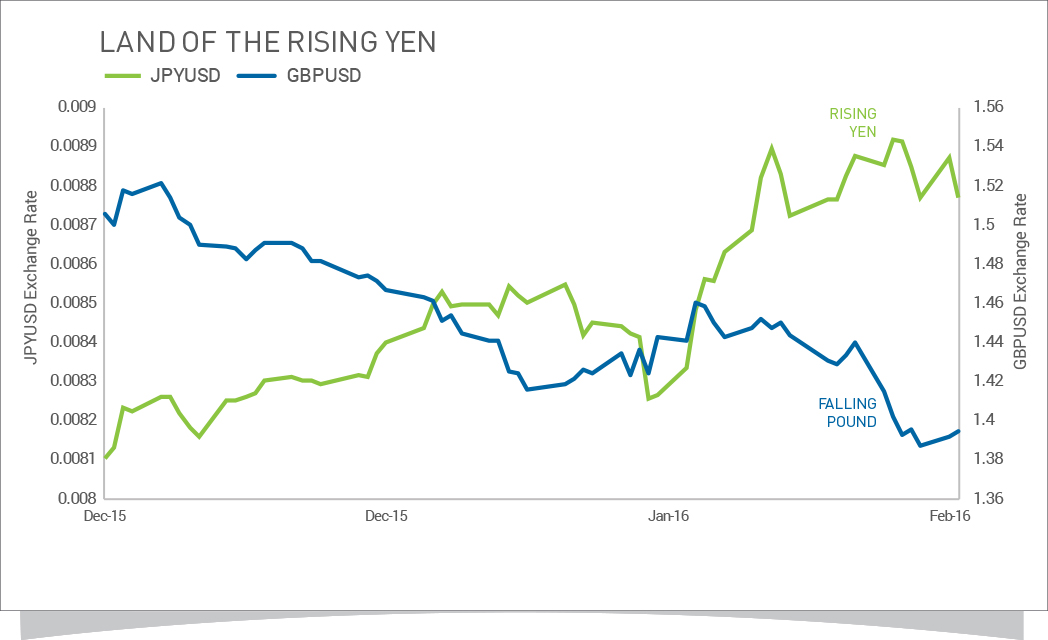
Portfolio holdings are subject to change at any time and should not be considered investment advice. The information presented in the graph above is not meant to represent performance of the fund.
Taken together, these developments have sparked a significant trend in the Japanese yen against the British pound.
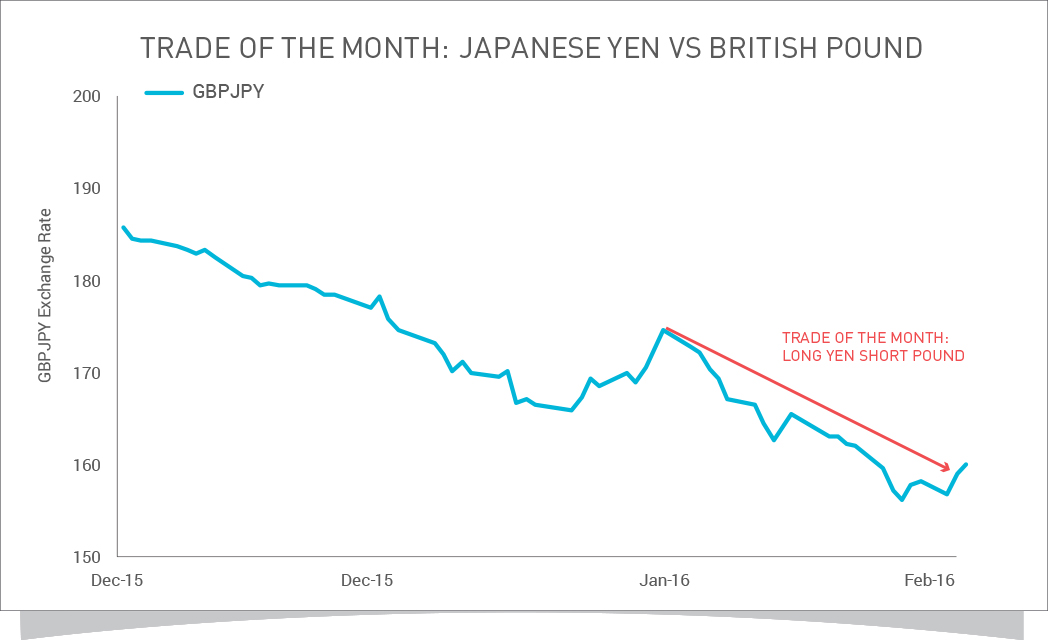
Portfolio holdings are subject to change at any time and should not be considered investment advice. The information presented in the graph above is not meant to represent the performance of the fund.
How Longboard aims to navigate today’s volatility
Longboard continues to be positioned short in accordance with the longer-term downtrends still in place across global stock and commodity markets, despite the shorter-term volatility.
We’re also taking advantage of the increase in currency movement by increasing our exposure as new trends develop, including long exposure to the Japanese yen.
Going forward, you can expect us to continue to execute our disciplined process of following long-term trends across global markets. For now, we continue to remain positioned short global equities and commodities markets, and see no immediate reason for these trends to reverse, at least in the short to medium term.
PAST RESULTS ARE NOT NECESSARILY INDICATIVE OF FUTURE RESULTS. THERE IS NO GUARANTEE THAT ANY INVESTMENT WILL ACHIEVE ITS GOALS AND GENERATE PROFITS OR AVOID LOSSES.