Building A Better Bracket
By Ross Hendricks
March 15, 2016
Performance principles to improve your March bracket and your investment portfolio
Every year, fans fill out their brackets for March’s mad dash to the collegiate basketball championship, trying to predict winners.
But what if we told you that poring over field goal percentages and points per game is a waste of time? And instead, you could use a simple, 100-year-old mathematical principle that might improve your results?
Even better, this same principle might help you make better long-term choices about which stocks to select for your investment portfolio.
The conventional wisdom
Many people assume performance data, like championship wins or semifinal appearances of college basketball teams, conforms to a bell-shaped curve. A bell curve represents a normal distribution, where performance among the population tends toward average results with a low chance of extreme outcomes.
Statisticians love a normal distribution because it simplifies the world and makes mathematical computations relatively easy and clean. Humans do too, because normal distributions reinforce our bias to underestimate the possibility of negative outcomes.
A non-normal world
Looking deeper, however, the bell curve loses its luster. In competitive areas like sports, outcomes rarely conform to this normal distribution.
Instead, we commonly observe a Pareto distribution (also known as the 80/20 rule) where 80% of the results are derived from 20% of the population. So, instead of performance tending toward an average, it leans toward the extremes, with a small minority dramatically outperforming the average. Studies have shown the Pareto distribution to exist across a diverse range of human endeavors — including sports, politics, entertainment and wealth.
Consider the following distribution of performance across the 300 most successful Division I basketball teams. We measured the number of times a given team progressed to the semifinals each year, going back to the tournament’s inception in 1939.*
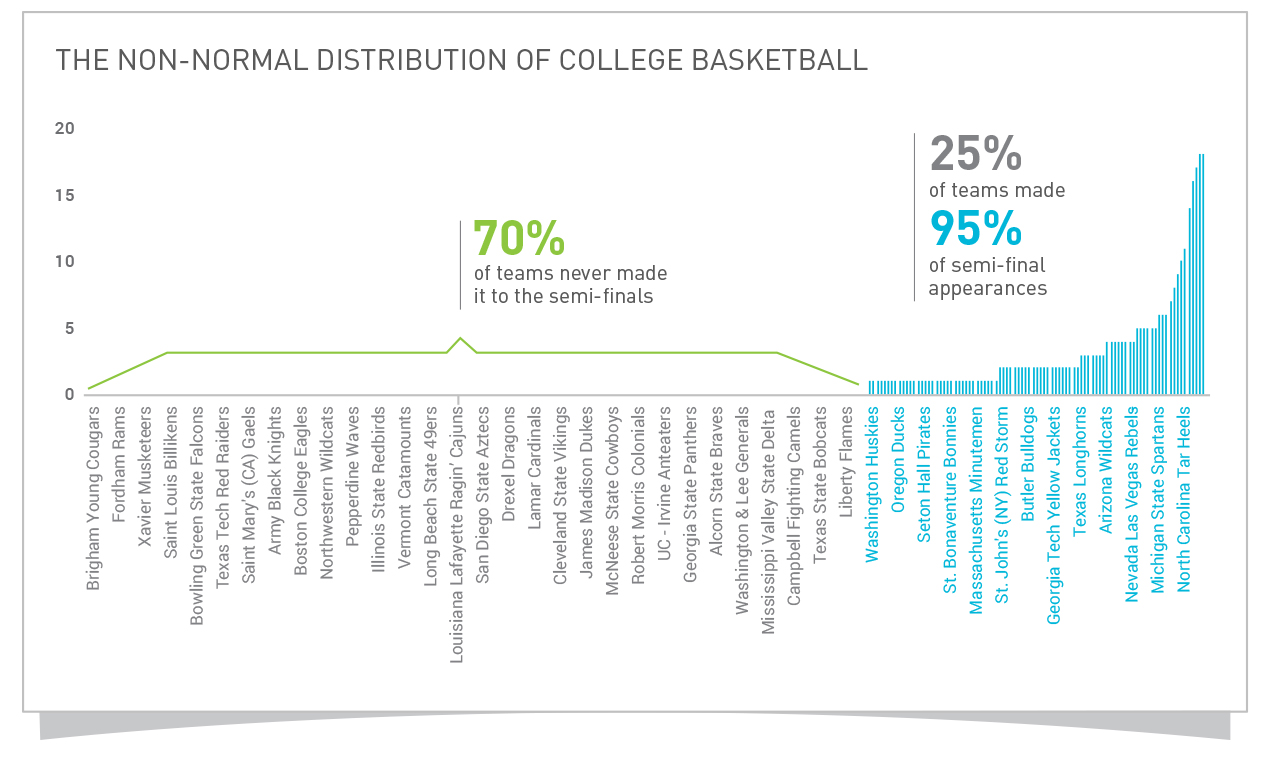
As you can see, the distribution is rather abnormal — the top 25% of teams dominate the league. Of the 300 potential appearances since the tournament’s inception, just over 25% of top performing teams ever made it to the semifinals. This means that, regardless of how convinced you are that 2016 is the year of the Northwestern Wildcats, the best long-term strategy is simply to fill your bracket with the top performers like the Tar Heels and the Spartans.
Stocks and sports — reflections of the same reality
Similar to championship sports teams, stock market winners tend to follow to a similar model.
In fact, stock market returns almost exactly mirror the distribution of performance of collegiate basketball championship teams. Longboard’s proprietary research showed that, from 1983 – 2007, among the largest 3,000 U.S. stocks, the top 25% captured all of the market’s upside. We term this result The Competition Gap, which we explore more fully in our signature research. We believe in this distribution so much that we’ve built our business around it.
Finance, much like college basketball, is often characterized by these extreme performances. They share another feature: discipline. In order to win the basketball championship, you have to fill your team with star players and continuously prune the underperformers to keep the performance drag from ruining your run to the top.
In your portfolio, the story is similar. In 2015, the high-growth momentum and financial stocks owned the court, but in 2016, defense is the new offense. Learn how we’re building our team in today’s market environment.
*We ranked the top 300 college basketball teams based on total franchise wins for our initial sample size. We then determined the percentage of those teams that were responsible for appearances in the semifinals in each year’s March tournament.
Dan Grossmann, Longboard portfolio consultant, contributed to this article.
A version of this article appeared in The Arizona Republic.
Tags: Investment strategy, Long-term trends, Portfolio diversification